
I’ve been following this project since its Kickstarter beginnings, and am pleased to see how well they’ve implemented their innovative idea at HowLoud.com. The goal is to provide a standardized measure of community noise levels in cities and towns across the country; they’re up to over a thousand now, including all mid-sized urban areas and many connecting regions of smaller towns in the east and midwest. Their “Soundscore” is a combination of traffic noise, airport noise, and general hubbub of nearby businesses; it’s all computer modeled, and overlaid on zoomable maps. Here are a couple of examples:
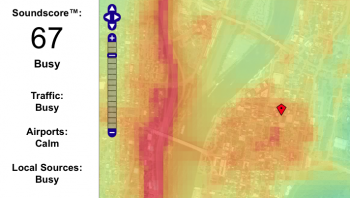 Troy, NY, a mid-sized college and old industrial town along the Hudson River. Note the I-787 corridor on the far side of the river, and the relatively rapid drop-off of neighborhood noise as you move away from the core downtown area.
 And my current home in Kennebunk, ME, in a quiet neighborhood. You can see the much smaller downtown noise footprint in the lower right, and the more modest highway noise from the Maine Turnpike on the left.
Check out your city or town here!
You can zoom in on these maps to pick out individual homes; part of HowLoud’s financial model is licensing these maps to real estate companies, in hopes that the relative Soundscore may become a selling point for homes in quieter areas. I can well imagine renters being equally interested in having better idea of where the sounds of a city center begin to moderate a bit.
The folks behind HowLoud have prioritized using a consistent metric nationwide, so that comparisons are valid. It seems to me that their 100-point scale is slightly nudged toward a suburban tolerance for noise, rather than than a deeply rural baseline. By that I mean that the dark-blue areas of their maps are probably not as totally free of noise as you may imagine; I’m thinking of the spot not far from my current home in the screenshot above, which looks to rate around 90, and a deeper blue zone in a land trust property in town that appears to be close to 100, neither of which is truly close to noise-free. I suspect that this may be largely due to the fuzziness of the Federal Highway Administration highway noise model that provides their foundation. These are based on 24-hour averages, which is practical for assessing impact, but doesn’t reflect on-the-ground experience: the 24-hr average is lower than the daytime peak of traffic noise, but higher than the nighttime average (but again, usually lower than the sound of a single car or truck passing in the night). The FHA model may also somewhat underestimate sound propagation from roads (for example, that Turnpike in the lower picture is readily audible at night, even in the dark blue zone).
But I’m nitpicking! This is a fantastic first take on an initiative that we really should extend to include the vast, un-urbanized parts of the country as well. NOAA is beginning to do these sorts of noise model maps for the world’s oceans, while the National Park Service and other researchers have done some country-wide modeling similar to this project. I’m all for the potential to use these techniques as a way to target remaining refuges of natural quiet for recognition and protection in the years and decades to come; every little relatively quiet pocket is valuable, and maps like these can help us realize what’s still there, just far enough from roads that we can still experience the landscape on its own terms.
February 15th, 2016 at 5:10 pm
Fantastic! Thanks for sharing, Jim.